Exosomes were first discovered in the supernatant of sheep red blood cells cultured in vitro. They are vesicle-like bodies with a relatively uniform size and a diameter of 40-100 nm and a density of 1.10~1.18 g/ml.
Exocytic bodies carry a variety of proteins, mRNAs, and miRNAs, and participate in processes such as cell communication, cell migration, angiogenesis, and tumor cell growth, and may become natural carriers of drugs for clinical treatment. However, the limitations of measurement techniques limit the research progress of exosomes in these areas. Therefore, in this article, we summarize the purification methods of exosomes, compare existing exosome measurement techniques, and highlight a new measurement technique, nanoparticle tracking analysis, in exosome size and characterization. Application in research.
1. Exosome extraction and methodological evaluation
So far, there is still no way to ensure the content, purity and biological activity of exosomes at the same time.
1.1 Centrifugation
This is currently the most common method of exosomal extraction. Briefly, after collecting the cell culture medium, cell debris and macromolecular proteins were removed by centrifugation at 300 g, 2 000 g, and 10 000 g, and finally 100 000 g was centrifuged to obtain exosomes. The amount of exosomes obtained by this method is large, but the purity is insufficient. When the electron microscopic identification is found, the exosomes are aggregated. Because microbubbles and exosomes do not have very uniform and identification criteria, some studies have found that this method is obtained. It is microbubbles that are not exosomes.
1.2 Filtering and centrifugation
Filtration centrifugation is the separation of exosomes by ultrafiltration membranes with different molecular weight cut-offs (MWCO). Intercepting relative molecular mass refers to the relative molecular mass of the largest molecule in a molecule that is free to pass through a porous material. Exosomes are a vesicular body with a relative molecular mass greater than that of normal proteins. Therefore, different sizes of MWCO membranes can be used to separate exosomes from other macromolecules. This operation is simple and time-saving, and does not affect the biological activity of the exosomes, but there is also a problem of insufficient purity.
1.3 density gradient centrifugation
Density gradient centrifugation is the ultracentrifugation of the sample together with the gradient material. The different components in the sample are settled into their respective equal density zones and divided into continuous and discontinuous gradient centrifugation. The medium used for density gradient centrifugation requires no toxicity to cells, is not highly viscous at high concentrations, and is easy to adjust the pH to neutral. In the experiment, sucrose density gradient centrifugation method is used. On the basis of centrifugation, two concentrations of sucrose solution (such as 2.5 M and 0.25 M) are preliminarily placed in a super-centrifuge tube, and the sample is placed on a sucrose solution. After centrifugation at 100 000 g for 16 h, the exosomes will settle to the iso-density zone (1.10~1.18 g/ml). The exosomes isolated by this method have high purity, but the preliminary preparation work is complicated, time consuming, and small in amount.
1.4 immunomagnetic beads method
The immunomagnetic beads are spherical magnetic particles coated with a monoclonal antibody and specifically bind to a target substance. Similarly, on the basis of the centrifugation method, the magnetic beads were coated with an antibody against the exosomal-associated antigen (such as CD9, CD63, Alix) and the exosomes were incubated in advance, rinsed with distilled water, and resuspended in PBS buffer. This method can ensure the integrity of the exosomes, high specificity, simple operation, and does not require expensive equipment, but non-neutral pH and non-physiological salt concentration will affect the biological activity of exosomes, and it is inconvenient to proceed to the next step. experiment.
1.5 Chromatography
Chromatography is a method of analyzing the separation of solutes based on the relative relationship between the pore size of the gel pores and the size of the sample molecules. Large molecules in the sample cannot enter the gel pores, and can only pass through the column between the porous gel particles, and are first eluted by the mobile phase; small molecules can enter most of the pores in the gel, and are more affected in the column. Strongly retained and eluted more slowly. The separated exosomes are uniform in size under the electron microscope, but require special equipment and are not widely used.
2. Comparison of various methods for exosomes measurement
2.1 Electron microscope
The scanning electron microscope (SEM) works on the surface of the sample to be analyzed by means of an electron beam with an energy of 1-30 KV, which is generated by the interaction between the incident electron and the surface material of the sample. The sub-electron and backscattered electrons were imaged to obtain the microstructure and morphology information of the sample surface. High resolution. Due to the development of ultra-high vacuum technology, the application of field emission electron guns has been popularized. The resolution of modern advanced scanning electron microscopes has reached about 1 nanometer, which is enough for the measurement of exosomes. In view of the working characteristics of SEM, in the study of exosomes, the morphology of exosomes in the samples can be directly observed. And SEM has a high resolution and can identify different sizes of exosomes. However, SEM has higher requirements for pretreatment and preparation of samples, and the preparation stage of the sample is more complicated, which is not suitable for a large number of rapid measurements of exosomes. Moreover, since the exosomes have undergone pretreatment and preparation processes, it is not possible to accurately measure the concentration of exosomes.
2.2 Dynamic light scattering technology
Dynamic light scattering is the variation of the intensity of the scattered light intensity of the particles in the collection solution. The fluctuation of the light intensity is converted into a correlation curve by the correlator, so that the velocity of the light intensity fluctuation is obtained, and the diffusion velocity information of the particle and the particle are calculated. Particle size. The Brownian motion of the small particle sample is fast, the light intensity fluctuates faster, the correlation curve decays faster, and the larger particle is reversed (Fig. 1).


Fig.1 Light intensity fluctuation and correlation curve of large particles and small particles
In exosomes, dynamic light scattering measurements have a high sensitivity and the lower limit of measurement is 10 nm. Compared with SEM technology, the sample preparation is simple, only simple filtration is required, and the measurement speed is fast. However, since the dynamic light scattering technique is the fluctuation data of the measured light intensity, the light intensity fluctuation signal of the large particle will cover the light intensity fluctuation signal of the smaller particle, so the dynamic light scattering is not suitable for the measurement of the complex exosome sample of different sizes. It is only suitable for size measurement of uniform size exosomes prepared by chromatography, and the concentration of exosomes in the sample cannot be measured.
2.3 Nanoparticle Tracking Analysis
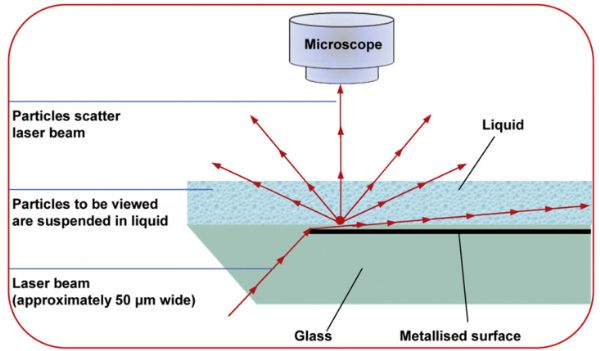
Nanoparticle Tracking Analysis (NTA) is a relatively novel method for studying nanoparticles that allows direct and real-time observation of nanoparticles. The NTA collects the scattered light signals of the nanoparticles by optical microscopy, captures an image of the Brownian motion of the nanoparticles in solution, and tracks and analyzes the Brownian motion of each particle to calculate the hydrodynamic radius and concentration of the nanoparticles.
The NTA system works by irradiating a beam of concentrated laser light through a glass prism to the sample (a solution of suspended particles) (see Figure 2 for the optical path). 
Figure 2 NTA laser light path diagram
The laser beam enters the sample solution from a small angle to illuminate the particles in the solution. An optical microscope equipped with a camera is placed at a specific location to collect light scattering signals from the illuminated nanoparticles in the field of view. The sample cell has a depth of approximately 500 microns and the sample point laser illumination width is 20 microns, which matches the focused depth of field of the optical microscope. The camera will take 60 seconds of image capture with 30 sample frames per second. The motion of the particles was analyzed by NTA software. The NTA software identifies and tracks the nanoparticles that make Brownian motion in each recorded image.
Calculating the particle hydrodynamic radius by two-dimensional Stokes-Einstein equation based on the velocity of the particle

In the equation

Where d is the diameter of the particle, λ is the wavelength of the incident light, and n is the ratio of the refractive index of the particle to the solution. In general, biological samples, such as exosomes, have a low refractive index, so the lower limit of measurement is 30-40 nm.
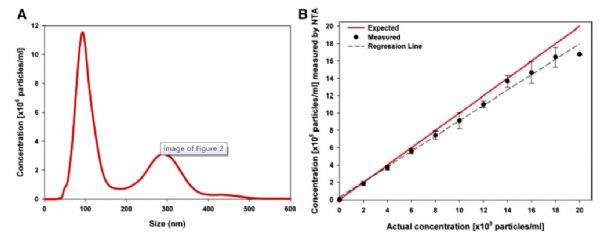
Since NTA technology directly tracks every nanoparticle in a sample, it determines that NTA has a very high resolution for complex samples. To prove the resolving power of NTA for complex samples, we will combine two different sizes of 100 nm and 300 nm. The styrene particles were mixed in an amount of 5:1 and measured using NTA (Fig. 3A). Although the distribution patterns have some overlap, the peaks of the two differently sized nanoparticles are clearly distinguished. This ability to resolve complex samples is very important for subjects such as exosomes.
The NTA also allows direct measurement of sample concentration. A series of 100 nm monodisperse samples with a concentration of 1×10⁸ - 8×10⁸ were measured. It can be seen that there is a good linear correlation between the NTA measured concentration results and the actual concentration (Fig. 3B). For polydisperse systems, the accuracy of the measurement depends on the instrument parameters (camera shutter speed and aperture). Proper parameter settings ensure that particles of different sizes are tracked and calculated by the NTA software.

Figure 3 A. NTA measurement of 100 nm and 300 nm mixed samples B. Linear correlation between NTA measured concentration and actual sample concentration
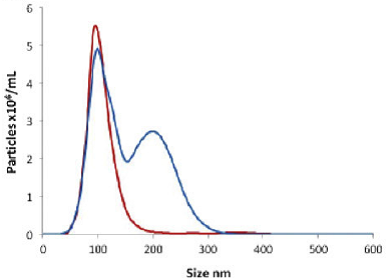
NTA also has the ability to analyze fluorescent samples. NTA has four different wavelengths of 405 nm, 488 nm, 532 nm and 635 nm. Lasers can be selected with the corresponding filters to achieve measurement of fluorescent samples. A 100 nm fluorescently labeled particle and a 200 nm non-fluorescent particle were mixed with the same solvent and measured using NTA (Fig. 4). In Fig. 4, the blue line shows the light scattering mode of NTA. Even though the profiles of the 100 nm and 200 nm nanoparticles overlap, the peaks of 100 nm and 200 nm are clearly distinguished. Then using a fluorescence filter for analysis, only 100 nm of fluorescently labeled nanoparticles (red line) were observed.

Figure 4 NTA fluorescence sample measurement
Due to the presence of transmembrane molecules such as CD9 and CD63 on the surface of exosomes, in complex background environments (such as serum), exosomes can be labeled with fluorescent antibodies, and the complex measurement is performed using the fluorescence measurement function of NTA. Measurement of exosomes. Compared with the fluorescence function of flow cytometry, NTA has higher resolution. The lower limit of measuring fluorescent particles can reach 30-40 nm, while the lower limit of measurement by flow cytometry is 400 nm, even for the latest generation of digital flow cells. The instrument has a lower measurement limit of 100 nanometers, but since it is still based on monitoring optical signals, measurement and accuracy and resolution are still unreliable. Therefore, NTA has unique advantages in measuring exosome fluorescence function.
3. Summary
The study of exosomes as biomarkers is currently in its infancy, but clinical applications have shown good prospects. In clinical diagnosis, simple and rapid measurement of exosome concentration, size and characterization data in complex biological settings (eg plasma, urine) is an essential requirement. None of the existing methods can solve this problem perfectly. As a relatively new measurement technology, NTA has real-time observations, high resolution, accurate concentration measurement and fluorescence measurement functions, providing new ideas for the study of exosomes size and concentration.
Baby Bed,Folding Baby Bed,Best Swing Sleeping Crib,Light Shaker Baby Bed
DongGuan Baby-Plus baby ware Co., Ltd. , https://www.baby-plus.com