Many printing companies have already obtained the ISO 9000 certificate. The purpose is nothing more than to prove that their quality management has reached the approved standard, and to take this as the first step in the “Total Quality Management TQMâ€. Others such as the "Five-Factor Law," "6Sigma," and "Quality Circle," are also moving toward the concept of TQM.
Many people agree that ISO 9000 does help them improve the quality of their products and set guidelines for product standards. A series of working documents, monitoring books, etc., make daily production operations reach a specified level. However, ISO can only maintain a certain level of quality, and it will not allow the company to continuously improve and achieve the goal of “TQMâ€. Of course, the author once mentioned that the 6 Sigma and other methods can achieve the goal of TQM, but the so-called easy-to-know problem is difficult, and in addition to spending a lot of resources on the development, in terms of the manpower and financial resources of the printing industry, whether or not it is affordable is also questionable.
In fact, the "production daily report" of ISO documents provides us with a lot of useful data for analysis and improvement of products. In the past, we often collected data from the "production daily report" to make different Pie Charts and counted them as accounts. Content is nothing more than: bad machine xx hours (xx%), xx hours (xx%), maintenance xx hours (xx%) and so on. These charts do not play a big role in analyzing and solving problems. In the face of these reports, there is a sense of catching the deer and not understanding it. The purpose of this paper is to use the Statistical Daily Process (SPC) method to analyze and solve problems using the data of the "production daily report". The so-called SPC refers to the use of statistical principles to identify problems. Excel already has these ready-made softwares. We can use it to write programs and build our own analysis tools.
Using Production Daily Report to Improve the Quality Management of Printing Room Machines
1) The performance of the printing press
Under ISO requirements, each printing press must fill out a "production daily report" that approximates the following. If we plot the downtime of one of the printing presses for the entire month, we can easily find problems and then apply the right medicine.
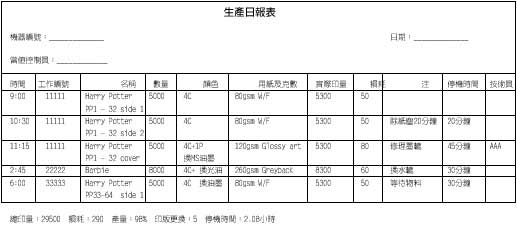
As can be seen from the figure below, on October 2 to 4 and October 17 to 18, respectively, the company spent a lot of time converting inks. The reason was that the guests demanded “coloring†but the colors did not meet their requirements. Therefore, we must constantly change colors and turn ink. The result is a waste of time on these tasks.
To find a solution, consider the following questions:
- Does the customer service department staff understand the requirements of the customer first and reach a consensus with the printing department before printing?
- Is the printing department insufficient to meet the guest's requirements?
- Is there any "color difference" in the printed paper and the problem of "out of color"?
- Is the guest excessively demanding waste? In the quotation, are these wastes also calculated within the cost?
From October 9 to December 12, it took half an hour to an hour each day to solve the problem of oil leakage. However, on the 19th, things happened again and spent a total of 4 hours on the 22nd to solve the problem.
In the same way, we can seek solutions by considering the following issues.
-Is the repair or maintenance company staff less than required, so that there is another maintenance?
- Does it take 4 hours to repair the oil when it leaks for the first time? Is it better to waste 1/2 hour to 1 hour (5 hours in total) every day?
- Is it a waste of time to replace problematic parts during regular maintenance?
- Has there been an appropriate channel to report the situation of the machine to colleagues in the printing department and solve the problem without having to spend 4 days each time to solve the problem?
Problems such as paper and zinc tablets occurred on Sundays and Mondays throughout the month, but this was not serious on other days.
Try to ask yourself the following questions:
- Does the Huanggang port have traffic jams on every Friday, slowing down the passage of paper?
- During the management's holiday, did the operating staff lack supervision or lack of decision-making capacity, resulting in such phenomena as waiting for paper, etc.?
- Did the management staff properly arrange all the work before the holiday, which led to confusion?
Respectively in October 1, 8, 10, 22, 29